An analysis of MLB umpire strike zones in 2023
Authors: Matthew Schneider and Karim Elsharkawy
This project analyzes the behavior of umpires in Major League Baseball (MLB) in 2023. Baseball is one of the most important sports in the United States, with its origins tracing back to the 1840s, although the modern game did not appear until the 1920s with the "live-ball era." The game involves two teams who take turn batting and fielding the ball. When a team is fielding the ball, a player known as the pitcher must throw a ball to a batter who tries to hit it with a bat. The goal is to hit the ball into the field of play and run the bases before he can be put out. Baseball is officiated by umpires. At the Major League level, there are usually four umpires per game, one per base. One umpire is assigned to home plate. This home plate umpire has the additional responsibility of managing what is known as the strike zone.
A batter only has a limited number of opportunities to swing at pitches during one plate appearance, or the time he is at bat against a pitcher. The pitcher is also expected to throw pitches that can be reasonably expected to be hit by a batter. These aspects of the game are mediated through something called the count, which measures the number of balls and strikes. When the pitcher throws a ball to the batter, the batter may choose to swing or not to swing. If the batter does not swing at the pitch (said to be a taken pitch), then the umpire must judge whether the path of the ball crossed through the strike zone.
- If the umpire deems that the ball crossed through the strike zone, then a strike is added to the count.
- If the umpire deems that the ball did not cross through the strike zone, then a ball is added to the count.
The count can determine the result of the plate apperance: if the count reaches three strikes, then the batter is out and does not get to play anymore (this is advantageous to the fielding team, because three outs ends the inning). If the count reaches four balls, then the batter is awarded a walk and may proceed to first base for free (this is advantageous to the hitting team).
In MLB, it is the sole responsibility of the home plate umpire to make this judgement call with his eyes. As such, he may be fallible to making an incorrect call. Missed calls can have a great effect on a single plate appearance. For example, if a ball is mistakenly called a strike on a 1-1 count (1 ball, 1 strike), the count moves to 1-2 (significantly in favor of the pitcher, since the batter is one strike from striking out) instead of 2-1 (in favor of the batter). In close games, the outcome of a single pitch can affect who wins and who loses as seen in a 2022 game:
The human definition of the strike zone
According to MLB,
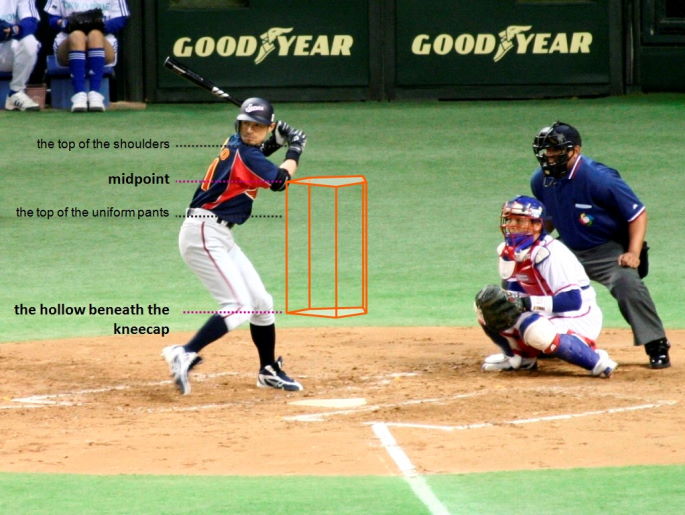
The official strike zone is the area over home plate from the midpoint between a batter's shoulders and the top of the uniform pants -- when the batter is in his stance and prepared to swing at a pitched ball -- and a point just below the kneecap. In order to get a strike call, part of the ball must cross over part of home plate while in the aforementioned area.
Here is a pictoral example of the 3D strike zone:
The computer definition of the strike zone
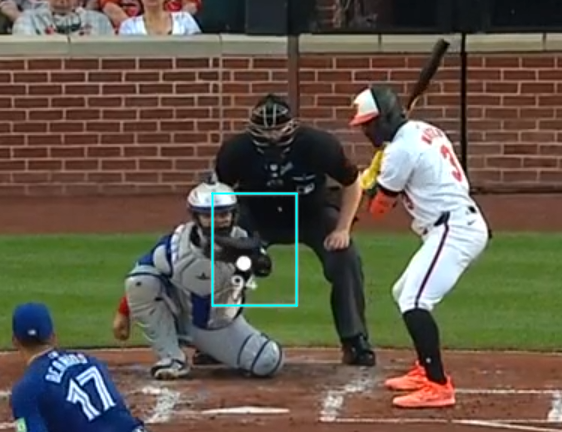
Computer pitch trackers use a more simplified definition of the strike zone, which we will adopt for our analysis. This is consistent with MLB's own internal zone rating metrics and other public sources for strike zone analysis. Compared to the rulebook definition, which prescribes a 3D zone in the shape of home plate, the computer zone is a 2D rectangle at the front of home plate, which we can see in the example image below outlined in blue:
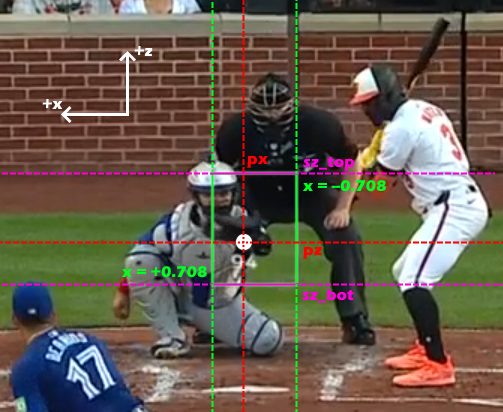
The entire baseball field is represented in three coordinate axes. The axes are represented in the dataset in units of feet. We only care about two axes, the x axis, which is the horizontal axis with respect to the image, and z axis, which is the vertical axis with respect to the picture. The reference points for the two axes are:
x = 0corresponds to the middle of home plate. Positivexvalues correspond to the left with respect to the image, negative values are to the right.z = 0corresponds to the ground. Positive values ofzindicate off the ground
The horizontal bounds of the strike zone correspond to the width of home plate. Home plate is 17 inches wide (or ~1.417 feet), and since x = 0 is the center of home plate, this places the horizontal boundaries of the zone at x = 0.708 and x = -0.708.
The vertical bounds for the zone are dependent on the batter's stance. In the dataset, these are represented by two values, sz_top corresponding to the top bound of the strike zone, and sz_bot corresponding to the bottom bound of the strike zone.
Lastly, we need to know the position of the ball. These are encoded in the values px and pz which correspond to the position of the center the ball as it crosses the front of home plate in the horizontal and vertical direction, respectively. Together, this gives us the following labelled example:
Thus, to calculate if the pitch crosses through the strike zone, we need to check any part of the ball clips through the 2D rectangle. Since the px and pz values only describe the center of the baseball, we must also consider its radius RAD, which is 0.12 feet. Thus, we must check two conditions:
- check if the pitch is horizontally in the strike zone:
-0.708 - RAD <= px <= 0.708 + RAD - check if the pitch is vertically in the strike zone:
sz_bot - RAD <= pz <= sz_top + RAD
The pitch is in the strike zone, and thus should be called a strike, if and only if both of the above conditions are true. For more information and an explainer video on reading computer strike zone data, see this article.
The dataset we are using includes a column called zone, which captures the MLB Gameday zone number:
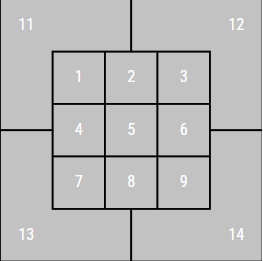
If the zone number is less than 10, then the pitch crossed through the strike zone. If the number is greater then 10, then the pitch did not cross through the strike zone. Note that 10 is not a valid number in the chart. We can rely on this data instead of doing the above calculations, although we expect both to be consistent.
First, we'll make some imports of things we need for this tutorial.
import requests
import json
import pandas as pd
import matplotlib.pyplot as plt
import numpy as np
import seaborn as sns
from sklearn.model_selection import train_test_split
from sklearn import metrics
from sklearn.metrics import classification_report
from sklearn.tree import DecisionTreeClassifier
from sklearn import tree
from sklearn import linear_model

pd.set_option('display.max_columns', None)
Data collection
MLB provides precise information for every pitch from every game dating back to 2015. We'll be looking at games from 2023 for this analysis.
Finding the list of 2023 games
First, we must find the list of games, which are identified by a unique ID (called game_pk) as assigned by MLB. We query MLB's StatsAPI in order to get all game_pk values from games in 2023.
r = requests.get("https://statsapi.mlb.com/api/v1/schedule",
                 params={"sportId": 1,              # indicates Major League Baseball (AL + NL)
                         "startDate": "2023-01-01", # start of 2023
                         "endDate": "2023-12-01",   # end of 2023
                         "gameTypes": "R"})         # only regular season games, no postseason or spring training

# The query includes a list of dates, and each date has a list of games for that day.
query = json.loads(r.content)

# extract each game_pk
game_pks = []
for date in query['dates']:
    for game in date['games']:
        game_pks.append(game['gamePk'])

# get rid of duplicates (happens due to postponements, which double counts the game for the originally scheduled date and actual date of the game)
games = list(set(game_pks))

print(len(games))                               # total number of games
print(games[0], games[1], games[2], games[3])   # print out first four game_pks as a sample
2430
716352 716353 716354 716355
We expect there to be 2,430 games in the regular season for 2023, based on the schedule of 162 games for 30 teams (so that 2430 = 162 * 30 / 2). Other seasons may have more or less, for example "Game 163" which used to be played as a tiebreaker in the standing, cancelled games which are not rescheduled, and, notably, the 2020 season which was shortened to 60 games per team because of COVID-19.
Getting pitch data from all 2023 games
Next, we query games from GameFinder (provided by BaseballSavant) and StatsAPI (provided by MLB) to get the pitch data from every game. The reason we need to query both sources is because the two on their own do not supply enough information for each pitch. Gamefinder reports the number of outs for a particular pitch as the number of outs following the plate appearance (rather than the number live during the at bat). StatsAPI reports the count (balls and strikes) following the pitch (not before the pitch).
Each pitch is assigned its own play_id which is consistent across BaseballSavant and StatsAPI, which allows us to easily join the DataFrames generated from the two sources together.
# This function takes in a `game_pk` and returns a DataFrame of all pitches corresponding to that game.
def get_game_pitches(game_pk):
    # download game data from gamefinder through a request
    r = requests.get("https://baseballsavant.mlb.com/gf", params={"game_pk": game_pk})
    game = json.loads(r.content)

    # collect all pitches
    # gamefinder sorts all pitch data by who is the team pitching (home/away) and has a list of all those pitches
    away_pitches = pd.DataFrame(game['team_away'])      # away team is pitching/ home team is batting
    home_pitches = pd.DataFrame(game['team_home'])      # home team is pitching/ away team is batting

    # assign top/bottom half of innings based on who is pitching
    away_pitches["half_inning"] = "bottom"
    home_pitches["half_inning"] = "top"

    # concatenate the two dataframes
    pitches = pd.concat([away_pitches, home_pitches], ignore_index = True)

    # place information about the game as a whole in each row
    pitches["away_team"]   = game["scoreboard"]["teams"]["away"]["name"]
    pitches["away_abbrev"] = game["scoreboard"]["teams"]["away"]["abbreviation"]
    pitches["home_team"]   = game["scoreboard"]["teams"]["home"]["name"]
    pitches["home_abbrev"] = game["scoreboard"]["teams"]["home"]["abbreviation"]

    pitches["date"]      = game["scoreboard"]["datetime"]["officialDate"]
    pitches["day_night"] = game["scoreboard"]["datetime"]["dayNight"]

    # we need to find who is the home plate umpire for this particular game
    # we search through the list of officials to find which one is designated "Home Plate"
    try:
        umpire = next((umpire for umpire in game['boxscore']['officials'] if umpire["officialType"] == "Home Plate"), None)["official"]["fullName"]
    except KeyError:
        umpire = None
    pitches["plate_umpire"] = umpire    # add as a new column

    pitches.drop(columns=["outs"], inplace=True)    # drop this column since it is inaccurate

    # get the remaining information through StatsAPI
    r = requests.get(f"https://statsapi.mlb.com/api/v1.1/game/{game_pk}/feed/live")
    game = json.loads(r.content)

    # this function extracts a dataframe of pitches from statsapi v1.1 data
    def get_pitches_play(play):
        df = pd.DataFrame(play['playEvents'])
        df['event_description'] = play['result']['event']
        df['event_type'] = play['result']['eventType']
        return df[df['isPitch'] == True]

    # get the pitches for all the plays
    # statsapi organizes pitches by plate appereance (i.e. a list of plate appearances, each with a list of pitches from that plate appearance)
    extra = pd.concat([get_pitches_play(play) for play in game['liveData']['plays']['allPlays']], axis=0, ignore_index = True)

    # the data is stored a dictionary of dictionaries, so we flatten all these so that all the parameters are at the same level
    extra = pd.concat([extra.drop(['count'], axis=1), extra['count'].apply(pd.Series)], axis=1)
    extra = pd.concat([extra.drop(['details'], axis=1), extra['details'].apply(pd.Series)], axis=1)
    extra = pd.concat([extra.drop(['pitchData'], axis=1), extra['pitchData'].apply(pd.Series)], axis=1)
    extra = pd.concat([extra.drop(['breaks'], axis=1), extra['breaks'].apply(pd.Series)], axis=1)

    # the `runnerGoing` column is either True or blank (NA), so we fill the NAs with false
    try:
        extra['runner_going'] = extra['runnerGoing'].fillna(False)
    except KeyError:
        extra['runner_going'] = False

    # set extra break information to NaN if it is not available
    if 'spinDirection' not in extra:
        extra['spinDirection'] = np.NaN
    if 'breakVertical' not in extra:
        extra['breakVertical'] = np.NaN
        extra['breakHorizontal'] = np.NaN
        extra['breakLength'] = np.NaN
        extra['breakAngle'] = np.NaN

    # rename `play_id` for easier merging
    extra.rename({"playId": "play_id"}, inplace=True, axis=1)
    # extract just the extra columns we want from statsapi
    extra = extra[['play_id', 'outs', 'runner_going', 'spinDirection', 'event_type', 'event_description',
                   'breakVertical', 'breakHorizontal', 'breakLength', 'breakAngle']]

    # merge the two dataframes together
    return pd.merge(pitches, extra, how="left", on=["play_id"])
Now that we have a function which gets us the pitches corresponding to an individual game_pk, let's run it on all the game_pks we have for 2023 and compile the results together. Expect this routine to take a lot of time!
game_pitches = list(map(get_game_pitches, games))

all_pitches = pd.concat(game_pitches, ignore_index = True)
all_pitches.set_index("play_id", inplace=True)
all_pitches.head()
C:\Users\Matthew\AppData\Local\Temp\ipykernel_68740\602634917.py:3: FutureWarning: The behavior of DataFrame concatenation with empty or all-NA entries is deprecated. In a future version, this will no longer exclude empty or all-NA columns when determining the result dtypes. To retain the old behavior, exclude the relevant entries before the concat operation.
  all_pitches = pd.concat(game_pitches, ignore_index = True)
| inning | ab_number | cap_index | batter | stand | batter_name | pitcher | p_throws | pitcher_name | team_batting | team_fielding | team_batting_id | team_fielding_id | result | des | events | contextMetrics | strikes | balls | pre_strikes | pre_balls | call | call_name | pitch_type | pitch_name | description | result_code | pitch_call | is_strike_swinging | balls_and_strikes | start_speed | end_speed | sz_top | sz_bot | extension | plateTime | zone | spin_rate | px | pz | x0 | y0 | z0 | ax | ay | az | vx0 | vy0 | vz0 | pfxX | pfxZ | pfxZWithGravity | pfxZWithGravityNice | pfxZDirection | pfxXWithGravity | pfxXNoAbs | pfxXDirection | breakX | breakZ | inducedBreakZ | is_bip_out | pitch_number | player_total_pitches | player_total_pitches_pitch_types | game_total_pitches | rowId | game_pk | player_name | hit_speed_round | hit_speed | hit_distance | xba | hit_angle | is_barrel | hc_x | hc_x_ft | hc_y | hc_y_ft | runnerOn1B | runnerOn2B | runnerOn3B | half_inning | away_team | away_abbrev | home_team | home_abbrev | date | day_night | plate_umpire | outs | runner_going | spinDirection | event_type | event_description | breakVertical | breakHorizontal | breakLength | breakAngle | |
|---|---|---|---|---|---|---|---|---|---|---|---|---|---|---|---|---|---|---|---|---|---|---|---|---|---|---|---|---|---|---|---|---|---|---|---|---|---|---|---|---|---|---|---|---|---|---|---|---|---|---|---|---|---|---|---|---|---|---|---|---|---|---|---|---|---|---|---|---|---|---|---|---|---|---|---|---|---|---|---|---|---|---|---|---|---|---|---|---|---|---|---|---|---|---|---|---|---|---|
| play_id | ||||||||||||||||||||||||||||||||||||||||||||||||||||||||||||||||||||||||||||||||||||||||||||||||||
| fd40dc91-e458-47d4-81d4-bdd654781440 | 1 | 6 | 0 | 672580 | R | Maikel Garcia | 650633 | R | Michael King | KC | NYY | 118 | 147 | Lineout | Maikel Garcia lines out to center fielder Este... | Lineout | {} | 0 | 0 | 0 | 0 | S | Strike | SI | Sinker | Called Strike | C | called_strike | False | 00 | 92.0 | 85.2 | 3.531020 | 1.612927 | 5.922587 | 0.407594 | 7.0 | 2491.0 | -0.292692 | 2.207051 | -2.461166 | 50.003600 | 5.557445 | -17.086921 | 25.264212 | -25.635070 | 8.973728 | -133.710840 | -4.062951 | -9.312735 | 3.563786 | -26.040910 | 26.0 | ↓ | 16 | -16 | → | 15.0 | 27.0 | 5.0 | Y | 1 | 1 | 1 | 23 | 23-716352 | 716352 | NYY | NaN | NaN | NaN | NaN | NaN | NaN | NaN | NaN | NaN | NaN | NaN | NaN | NaN | bottom | New York Yankees | NYY | Kansas City Royals | KC | 2023-10-01 | day | Clint Vondrak | 0 | False | 200.0 | field_out | Lineout | -26.2 | 15.2 | 7.2 | 30.0 |
| 60d12f55-1c47-42da-8f3e-d3e2e6e47ee2 | 1 | 6 | 0 | 672580 | R | Maikel Garcia | 650633 | R | Michael King | KC | NYY | 118 | 147 | Lineout | Maikel Garcia lines out to center fielder Este... | Lineout | {} | 1 | 0 | 1 | 0 | S | Strike | FF | 4-Seam Fastball | Swinging Strike | S | swinging_strike | True | 01 | 93.8 | 86.9 | 3.590000 | 1.730000 | 5.691580 | 0.398518 | 11.0 | 2330.0 | -1.158241 | 3.385914 | -2.388350 | 50.006551 | 5.757462 | -6.665766 | 26.327695 | -16.695794 | 4.566470 | -136.737542 | -3.362402 | -3.472281 | 8.067414 | -17.017648 | 17.0 | ↓ | 6 | -6 | → | 6.0 | 17.0 | 14.0 | Y | 2 | 2 | 1 | 24 | 24-716352 | 716352 | NaN | NaN | NaN | NaN | NaN | NaN | NaN | NaN | NaN | NaN | NaN | NaN | NaN | NaN | bottom | New York Yankees | NYY | Kansas City Royals | KC | 2023-10-01 | day | Clint Vondrak | 0 | False | 212.0 | field_out | Lineout | -16.4 | 5.5 | 3.6 | 18.0 |
| 50bd9d0f-eee5-4f99-9dc4-a1fa02594bf9 | 1 | 6 | 0 | 672580 | R | Maikel Garcia | 650633 | R | Michael King | KC | NYY | 118 | 147 | Lineout | Maikel Garcia lines out to center fielder Este... | Lineout | {'homeRunBallparks': 0} | 2 | 0 | 2 | 0 | X | In Play | FF | 4-Seam Fastball | In play, out(s) | X | hit_into_play | False | 02 | 94.3 | 87.4 | 3.590000 | 1.730000 | 6.028961 | 0.396397 | 11.0 | 2377.0 | -0.008739 | 3.769854 | -2.256394 | 50.001334 | 5.865596 | -6.578440 | 25.957664 | -16.315596 | 7.339570 | -137.357644 | -2.731021 | -3.389510 | 8.170515 | -16.518106 | 17.0 | ↓ | 6 | -6 | → | 5.0 | 16.0 | 14.0 | Y | 3 | 3 | 2 | 25 | 25-716352 | 716352 | NaN | 99.0 | 99.4 | 360 | .410 | 18 | 0.0 | 114.37 | -26.104127 | 54.75 | 358.29979 | NaN | NaN | NaN | bottom | New York Yankees | NYY | Kansas City Royals | KC | 2023-10-01 | day | Clint Vondrak | 0 | False | 203.0 | field_out | Lineout | -15.8 | 4.9 | 3.6 | 16.8 |
| 6c79e8ff-4972-4ad1-85cb-f994727c1f90 | 1 | 7 | 0 | 677951 | R | Bobby Witt Jr. | 650633 | R | Michael King | KC | NYY | 118 | 147 | Groundout | Bobby Witt Jr. grounds out, second baseman Os... | Groundout | {} | 0 | 0 | 0 | 0 | S | Strike | SI | Sinker | Called Strike | C | called_strike | False | 00 | 93.5 | 87.0 | 3.403536 | 1.631027 | 5.979491 | 0.400484 | 9.0 | 1859.0 | 0.311409 | 1.618673 | -2.256811 | 50.004739 | 5.486336 | -17.570281 | 25.019013 | -22.974243 | 10.189194 | -135.885978 | -6.196413 | -9.236481 | 4.838141 | -22.778260 | 23.0 | ↓ | 16 | -16 | → | 15.0 | 23.0 | 7.0 | Y | 1 | 4 | 2 | 26 | 26-716352 | 716352 | NaN | NaN | NaN | NaN | NaN | NaN | NaN | NaN | NaN | NaN | NaN | NaN | NaN | NaN | bottom | New York Yankees | NYY | Kansas City Royals | KC | 2023-10-01 | day | Clint Vondrak | 1 | False | 165.0 | field_out | Groundout | -23.2 | 15.0 | 6.0 | 33.6 |
| e3f2d82a-9778-43aa-a813-05f91eb2122e | 1 | 7 | 0 | 677951 | R | Bobby Witt Jr. | 650633 | R | Michael King | KC | NYY | 118 | 147 | Groundout | Bobby Witt Jr. grounds out, second baseman Os... | Groundout | {} | 1 | 0 | 1 | 0 | B | Ball | SI | Sinker | Ball | B | ball | False | 01 | 94.0 | 86.8 | 3.491020 | 1.660077 | 6.095591 | 0.398597 | 11.0 | 2321.0 | -1.375257 | 2.676168 | -2.402972 | 50.001801 | 5.610981 | -15.254782 | 27.280516 | -20.179332 | 5.599407 | -136.873132 | -4.246522 | -7.957966 | 6.256626 | -20.090125 | 20.0 | ↓ | 13 | -13 | → | 14.0 | 20.0 | 11.0 | Y | 2 | 5 | 3 | 27 | 27-716352 | 716352 | NaN | NaN | NaN | NaN | NaN | NaN | NaN | NaN | NaN | NaN | NaN | NaN | NaN | NaN | bottom | New York Yankees | NYY | Kansas City Royals | KC | 2023-10-01 | day | Clint Vondrak | 1 | False | 215.0 | field_out | Groundout | -19.9 | 13.4 | 4.8 | 33.6 |
Data cleaning
There are three major things we need to clean up about the data: (1) it includes the pitches that are swung that, not just the taken pitches that we care about; (2) it includes a lot of extra data in columns that we don't need; and (3) there are some rows with missing pitch tracking data.
Reorganize the columns
First, we rename some columns so that their names are more meaningful and so that they all follow the snake_case covnention (just for consistency's sake).
all_pitches.rename({'stand': 'batter_side',
                    'p_throws': 'pitcher_hand',
                    'pitch_type': 'pitch_code',
                    'pitch_name': 'pitch_description',
                    'description': 'result_description',
                    'plateTime': 'plate_time',
                    'zone': 'gameday_zone',
                    'pfxX': 'pfx_x', 'pfxZ': 'pfx_z',
                    'breakHorizontal': 'break_x', 'breakVertical': 'break_z',
                    'breakLength': 'break_length', 'breakAngle': 'break_angle',
                    "spinDirection": "spin_axis",
                    'runnerOn1B': 'runner_1b',
                    'runnerOn2B': 'runner_2b',
                    'runnerOn3B': 'runner_3b'}, axis=1,inplace=True)
Next, we'll extract just the columns we want. These columns include information about
- date/time of the game
- the teams playing
- the inning and number of outs
- if there are runners on base and if a runner is going on the pitch
- the pitcher and batter for that particular pitch
- the count (balls and strikes)
- the result of the pitch (e.g. ball, hit into play)
- the position of the ball as it crosses the front of home plate and MLB Gameday's zone determination
- the type of pitch (e.g. fastball, changeup)
- the speed of the pitch (both out of the hand and speed over home plate)
- kinematic information (position, velocity, acceleration) when the ball is 50 feet from the back of home plate
- spin on the ball based on pitcher's release
- break (how much movement the pitcher induces on the ball)
- eventual result of the plate appearance
- home plate umpire making the call
# reorder columns and drop the columns that we don't want
all_pitches = all_pitches[['game_pk', 'date', 'day_night',
                           'away_team', 'away_abbrev', 'home_team', 'home_abbrev',
                           'game_total_pitches',
                           'inning', 'half_inning', 'outs',
                           'runner_1b', 'runner_2b', 'runner_3b', 'runner_going',
                           'batter_name', 'batter_side', 'pitcher_name', 'pitcher_hand',
                           'pitch_number',
                           'balls', 'strikes',
                           'result_code', 'result_description',
                           'px', 'pz', 'sz_top', 'sz_bot',
                           'gameday_zone',
                           'pitch_code', 'pitch_description',
                           'start_speed', 'end_speed', 'plate_time',
                           'x0', 'y0', 'z0',
                           'vx0', 'vy0', 'vz0',
                           'ax', 'ay', 'az',
                           'pfx_x', 'pfx_z',
                           'spin_rate', 'spin_axis',
                           'break_x', 'break_z',
                           'break_length', 'break_angle',
                           'event_type', 'event_description',
                           'plate_umpire']]
Also, we have to update information about runners on base. It is reported as True if there is a runner on base and "NA" if there is not, which we will change to False.
all_pitches["runner_1b"] = all_pitches["runner_1b"].fillna(False)
all_pitches["runner_2b"] = all_pitches["runner_2b"].fillna(False)
all_pitches["runner_3b"] = all_pitches["runner_3b"].fillna(False)
Finally, here is the cleaned up data.
all_pitches.head()
| game_pk | date | day_night | away_team | away_abbrev | home_team | home_abbrev | game_total_pitches | inning | half_inning | outs | runner_1b | runner_2b | runner_3b | runner_going | batter_name | batter_side | pitcher_name | pitcher_hand | pitch_number | balls | strikes | result_code | result_description | px | pz | sz_top | sz_bot | gameday_zone | pitch_code | pitch_description | start_speed | end_speed | plate_time | x0 | y0 | z0 | vx0 | vy0 | vz0 | ax | ay | az | pfx_x | pfx_z | spin_rate | spin_axis | break_x | break_z | break_length | break_angle | event_type | event_description | plate_umpire | |
|---|---|---|---|---|---|---|---|---|---|---|---|---|---|---|---|---|---|---|---|---|---|---|---|---|---|---|---|---|---|---|---|---|---|---|---|---|---|---|---|---|---|---|---|---|---|---|---|---|---|---|---|---|---|---|
| play_id | ||||||||||||||||||||||||||||||||||||||||||||||||||||||
| fd40dc91-e458-47d4-81d4-bdd654781440 | 716352 | 2023-10-01 | day | New York Yankees | NYY | Kansas City Royals | KC | 23 | 1 | bottom | 0 | False | False | False | False | Maikel Garcia | R | Michael King | R | 1 | 0 | 0 | C | Called Strike | -0.292692 | 2.207051 | 3.531020 | 1.612927 | 7.0 | SI | Sinker | 92.0 | 85.2 | 0.407594 | -2.461166 | 50.003600 | 5.557445 | 8.973728 | -133.710840 | -4.062951 | -17.086921 | 25.264212 | -25.635070 | -9.312735 | 3.563786 | 2491.0 | 200.0 | 15.2 | -26.2 | 7.2 | 30.0 | field_out | Lineout | Clint Vondrak |
| 60d12f55-1c47-42da-8f3e-d3e2e6e47ee2 | 716352 | 2023-10-01 | day | New York Yankees | NYY | Kansas City Royals | KC | 24 | 1 | bottom | 0 | False | False | False | False | Maikel Garcia | R | Michael King | R | 2 | 0 | 1 | S | Swinging Strike | -1.158241 | 3.385914 | 3.590000 | 1.730000 | 11.0 | FF | 4-Seam Fastball | 93.8 | 86.9 | 0.398518 | -2.388350 | 50.006551 | 5.757462 | 4.566470 | -136.737542 | -3.362402 | -6.665766 | 26.327695 | -16.695794 | -3.472281 | 8.067414 | 2330.0 | 212.0 | 5.5 | -16.4 | 3.6 | 18.0 | field_out | Lineout | Clint Vondrak |
| 50bd9d0f-eee5-4f99-9dc4-a1fa02594bf9 | 716352 | 2023-10-01 | day | New York Yankees | NYY | Kansas City Royals | KC | 25 | 1 | bottom | 0 | False | False | False | False | Maikel Garcia | R | Michael King | R | 3 | 0 | 2 | X | In play, out(s) | -0.008739 | 3.769854 | 3.590000 | 1.730000 | 11.0 | FF | 4-Seam Fastball | 94.3 | 87.4 | 0.396397 | -2.256394 | 50.001334 | 5.865596 | 7.339570 | -137.357644 | -2.731021 | -6.578440 | 25.957664 | -16.315596 | -3.389510 | 8.170515 | 2377.0 | 203.0 | 4.9 | -15.8 | 3.6 | 16.8 | field_out | Lineout | Clint Vondrak |
| 6c79e8ff-4972-4ad1-85cb-f994727c1f90 | 716352 | 2023-10-01 | day | New York Yankees | NYY | Kansas City Royals | KC | 26 | 1 | bottom | 1 | False | False | False | False | Bobby Witt Jr. | R | Michael King | R | 1 | 0 | 0 | C | Called Strike | 0.311409 | 1.618673 | 3.403536 | 1.631027 | 9.0 | SI | Sinker | 93.5 | 87.0 | 0.400484 | -2.256811 | 50.004739 | 5.486336 | 10.189194 | -135.885978 | -6.196413 | -17.570281 | 25.019013 | -22.974243 | -9.236481 | 4.838141 | 1859.0 | 165.0 | 15.0 | -23.2 | 6.0 | 33.6 | field_out | Groundout | Clint Vondrak |
| e3f2d82a-9778-43aa-a813-05f91eb2122e | 716352 | 2023-10-01 | day | New York Yankees | NYY | Kansas City Royals | KC | 27 | 1 | bottom | 1 | False | False | False | False | Bobby Witt Jr. | R | Michael King | R | 2 | 0 | 1 | B | Ball | -1.375257 | 2.676168 | 3.491020 | 1.660077 | 11.0 | SI | Sinker | 94.0 | 86.8 | 0.398597 | -2.402972 | 50.001801 | 5.610981 | 5.599407 | -136.873132 | -4.246522 | -15.254782 | 27.280516 | -20.179332 | -7.957966 | 6.256626 | 2321.0 | 215.0 | 13.4 | -19.9 | 4.8 | 33.6 | field_out | Groundout | Clint Vondrak |
Only including taken pitches
The dataset we have includes all pitches that have been thrown in MLB in 2023, whereas we only want the data of pitches that were taken (i.e. not swung at by the batter). To do this we look at the result_code column which contains a code corresponding to the result of a particular pitch.
The codes we are interested in are:
- *B (ball in dirt)
- B (ball)
- C (called strike)
- H (hit by pitch)
- I (intentional ball)
- P (pitchout)
For those who know a little about baseball you might find it unusual to include the hit by pitch as a call. However the rules of baseball stipulate that a batter is not awarded first base after being hit by a pitch if the pitch went through the strike zone. That makes a hit by pitch also implicitly a called ball, so we can verify if the hit by pitch was granted correctly. Unfortunately, we don't have data for hit by pitches not awarded because the pitch was judged to have gone through the strike zone. They are scored as ordinary called strikes.
result_codes = ["*B", "B", "C", "H", "I", "P"]
taken_pitches = all_pitches[all_pitches['result_code'].isin(result_codes)]
taken_pitches.head()
| game_pk | date | day_night | away_team | away_abbrev | home_team | home_abbrev | game_total_pitches | inning | half_inning | outs | runner_1b | runner_2b | runner_3b | runner_going | batter_name | batter_side | pitcher_name | pitcher_hand | pitch_number | balls | strikes | result_code | result_description | px | pz | sz_top | sz_bot | gameday_zone | pitch_code | pitch_description | start_speed | end_speed | plate_time | x0 | y0 | z0 | vx0 | vy0 | vz0 | ax | ay | az | pfx_x | pfx_z | spin_rate | spin_axis | break_x | break_z | break_length | break_angle | event_type | event_description | plate_umpire | |
|---|---|---|---|---|---|---|---|---|---|---|---|---|---|---|---|---|---|---|---|---|---|---|---|---|---|---|---|---|---|---|---|---|---|---|---|---|---|---|---|---|---|---|---|---|---|---|---|---|---|---|---|---|---|---|
| play_id | ||||||||||||||||||||||||||||||||||||||||||||||||||||||
| fd40dc91-e458-47d4-81d4-bdd654781440 | 716352 | 2023-10-01 | day | New York Yankees | NYY | Kansas City Royals | KC | 23 | 1 | bottom | 0 | False | False | False | False | Maikel Garcia | R | Michael King | R | 1 | 0 | 0 | C | Called Strike | -0.292692 | 2.207051 | 3.531020 | 1.612927 | 7.0 | SI | Sinker | 92.0 | 85.2 | 0.407594 | -2.461166 | 50.003600 | 5.557445 | 8.973728 | -133.710840 | -4.062951 | -17.086921 | 25.264212 | -25.635070 | -9.312735 | 3.563786 | 2491.0 | 200.0 | 15.2 | -26.2 | 7.2 | 30.0 | field_out | Lineout | Clint Vondrak |
| 6c79e8ff-4972-4ad1-85cb-f994727c1f90 | 716352 | 2023-10-01 | day | New York Yankees | NYY | Kansas City Royals | KC | 26 | 1 | bottom | 1 | False | False | False | False | Bobby Witt Jr. | R | Michael King | R | 1 | 0 | 0 | C | Called Strike | 0.311409 | 1.618673 | 3.403536 | 1.631027 | 9.0 | SI | Sinker | 93.5 | 87.0 | 0.400484 | -2.256811 | 50.004739 | 5.486336 | 10.189194 | -135.885978 | -6.196413 | -17.570281 | 25.019013 | -22.974243 | -9.236481 | 4.838141 | 1859.0 | 165.0 | 15.0 | -23.2 | 6.0 | 33.6 | field_out | Groundout | Clint Vondrak |
| e3f2d82a-9778-43aa-a813-05f91eb2122e | 716352 | 2023-10-01 | day | New York Yankees | NYY | Kansas City Royals | KC | 27 | 1 | bottom | 1 | False | False | False | False | Bobby Witt Jr. | R | Michael King | R | 2 | 0 | 1 | B | Ball | -1.375257 | 2.676168 | 3.491020 | 1.660077 | 11.0 | SI | Sinker | 94.0 | 86.8 | 0.398597 | -2.402972 | 50.001801 | 5.610981 | 5.599407 | -136.873132 | -4.246522 | -15.254782 | 27.280516 | -20.179332 | -7.957966 | 6.256626 | 2321.0 | 215.0 | 13.4 | -19.9 | 4.8 | 33.6 | field_out | Groundout | Clint Vondrak |
| 38494e8c-a6db-48ae-93b0-08f09e346853 | 716352 | 2023-10-01 | day | New York Yankees | NYY | Kansas City Royals | KC | 29 | 1 | bottom | 1 | False | False | False | False | Bobby Witt Jr. | R | Michael King | R | 4 | 1 | 2 | B | Ball | 1.779492 | 1.317006 | 3.491020 | 1.718184 | 14.0 | ST | Sweeper | 81.9 | 76.2 | 0.458978 | -2.404842 | 50.003641 | 5.380935 | 7.232091 | -119.132844 | -2.905202 | 12.379237 | 21.944713 | -31.434472 | 8.574210 | 0.514236 | 2896.0 | 60.0 | -17.3 | -40.2 | 9.6 | 22.8 | field_out | Groundout | Clint Vondrak |
| 2334d79b-c2c7-4421-89b2-10cf4724d1d0 | 716352 | 2023-10-01 | day | New York Yankees | NYY | Kansas City Royals | KC | 31 | 1 | bottom | 2 | False | False | False | False | Salvador Perez | R | Michael King | R | 1 | 0 | 0 | C | Called Strike | 0.448960 | 3.073323 | 3.540189 | 1.649124 | 3.0 | SI | Sinker | 93.9 | 87.2 | 0.398503 | -2.280361 | 50.006529 | 5.488510 | 10.592485 | -136.501232 | -2.116903 | -17.286584 | 24.924189 | -24.112642 | -8.994766 | 4.199174 | 2288.0 | 225.0 | 14.5 | -23.3 | 6.0 | 32.4 | strikeout | Strikeout | Clint Vondrak |
Remove missing data
Sometimes, the dataset is missing information. We have already converted some expected missing data, where NA actually means False. However for the pitch location tracking sometimes we are just missing the parameters associated with a particular pitch. These seem to happen in either select games played at neutral site ballparks where the pitch tracking technology is not installed, or just random pitches from games where the technology is available. In both cases we assume that the fact that the data is missing is not related to the data itself, so we just remove those rows instead of doing any data imputation. In any case, the number of missing pitches is very small compared to the number of total pitches, so we do not expect the results of the analysis to change significantly had we had the full data from those pitches.
print("Number of taken pitches including incomplete observations:", len(taken_pitches))
taken_pitches = taken_pitches.dropna()
print("Number of taken pitches after removing incomplete observations:", len(taken_pitches))
taken_pitches.head()
Number of taken pitches including incomplete observations: 376681
Number of taken pitches after removing incomplete observations: 374426
| game_pk | date | day_night | away_team | away_abbrev | home_team | home_abbrev | game_total_pitches | inning | half_inning | outs | runner_1b | runner_2b | runner_3b | runner_going | batter_name | batter_side | pitcher_name | pitcher_hand | pitch_number | balls | strikes | result_code | result_description | px | pz | sz_top | sz_bot | gameday_zone | pitch_code | pitch_description | start_speed | end_speed | plate_time | x0 | y0 | z0 | vx0 | vy0 | vz0 | ax | ay | az | pfx_x | pfx_z | spin_rate | spin_axis | break_x | break_z | break_length | break_angle | event_type | event_description | plate_umpire | |
|---|---|---|---|---|---|---|---|---|---|---|---|---|---|---|---|---|---|---|---|---|---|---|---|---|---|---|---|---|---|---|---|---|---|---|---|---|---|---|---|---|---|---|---|---|---|---|---|---|---|---|---|---|---|---|
| play_id | ||||||||||||||||||||||||||||||||||||||||||||||||||||||
| fd40dc91-e458-47d4-81d4-bdd654781440 | 716352 | 2023-10-01 | day | New York Yankees | NYY | Kansas City Royals | KC | 23 | 1 | bottom | 0 | False | False | False | False | Maikel Garcia | R | Michael King | R | 1 | 0 | 0 | C | Called Strike | -0.292692 | 2.207051 | 3.531020 | 1.612927 | 7.0 | SI | Sinker | 92.0 | 85.2 | 0.407594 | -2.461166 | 50.003600 | 5.557445 | 8.973728 | -133.710840 | -4.062951 | -17.086921 | 25.264212 | -25.635070 | -9.312735 | 3.563786 | 2491.0 | 200.0 | 15.2 | -26.2 | 7.2 | 30.0 | field_out | Lineout | Clint Vondrak |
| 6c79e8ff-4972-4ad1-85cb-f994727c1f90 | 716352 | 2023-10-01 | day | New York Yankees | NYY | Kansas City Royals | KC | 26 | 1 | bottom | 1 | False | False | False | False | Bobby Witt Jr. | R | Michael King | R | 1 | 0 | 0 | C | Called Strike | 0.311409 | 1.618673 | 3.403536 | 1.631027 | 9.0 | SI | Sinker | 93.5 | 87.0 | 0.400484 | -2.256811 | 50.004739 | 5.486336 | 10.189194 | -135.885978 | -6.196413 | -17.570281 | 25.019013 | -22.974243 | -9.236481 | 4.838141 | 1859.0 | 165.0 | 15.0 | -23.2 | 6.0 | 33.6 | field_out | Groundout | Clint Vondrak |
| e3f2d82a-9778-43aa-a813-05f91eb2122e | 716352 | 2023-10-01 | day | New York Yankees | NYY | Kansas City Royals | KC | 27 | 1 | bottom | 1 | False | False | False | False | Bobby Witt Jr. | R | Michael King | R | 2 | 0 | 1 | B | Ball | -1.375257 | 2.676168 | 3.491020 | 1.660077 | 11.0 | SI | Sinker | 94.0 | 86.8 | 0.398597 | -2.402972 | 50.001801 | 5.610981 | 5.599407 | -136.873132 | -4.246522 | -15.254782 | 27.280516 | -20.179332 | -7.957966 | 6.256626 | 2321.0 | 215.0 | 13.4 | -19.9 | 4.8 | 33.6 | field_out | Groundout | Clint Vondrak |
| 38494e8c-a6db-48ae-93b0-08f09e346853 | 716352 | 2023-10-01 | day | New York Yankees | NYY | Kansas City Royals | KC | 29 | 1 | bottom | 1 | False | False | False | False | Bobby Witt Jr. | R | Michael King | R | 4 | 1 | 2 | B | Ball | 1.779492 | 1.317006 | 3.491020 | 1.718184 | 14.0 | ST | Sweeper | 81.9 | 76.2 | 0.458978 | -2.404842 | 50.003641 | 5.380935 | 7.232091 | -119.132844 | -2.905202 | 12.379237 | 21.944713 | -31.434472 | 8.574210 | 0.514236 | 2896.0 | 60.0 | -17.3 | -40.2 | 9.6 | 22.8 | field_out | Groundout | Clint Vondrak |
| 2334d79b-c2c7-4421-89b2-10cf4724d1d0 | 716352 | 2023-10-01 | day | New York Yankees | NYY | Kansas City Royals | KC | 31 | 1 | bottom | 2 | False | False | False | False | Salvador Perez | R | Michael King | R | 1 | 0 | 0 | C | Called Strike | 0.448960 | 3.073323 | 3.540189 | 1.649124 | 3.0 | SI | Sinker | 93.9 | 87.2 | 0.398503 | -2.280361 | 50.006529 | 5.488510 | 10.592485 | -136.501232 | -2.116903 | -17.286584 | 24.924189 | -24.112642 | -8.994766 | 4.199174 | 2288.0 | 225.0 | 14.5 | -23.3 | 6.0 | 32.4 | strikeout | Strikeout | Clint Vondrak |
Compare the number of rows we had before (376,681) with the number of rows we have left (374,426), meaning that missing data represented about 0.6% of the total number of pitches.
Exploratory data analysis
We start by adding in a few utility columns that will make the analysis easier:
expected_callencodes whether or not the ball entered the strike zone as a boolean value (True = strike, False = ball)actual_callrepresents what the umpire called it (True = strike, False = ball)correct_calldetermines whether or not the umpire's call was correct
def expected_strike(zone):
    return int(zone) < 10

def actual_strike(result_code):
    return result_code == "C"

taken_pitches['expected_call'] = taken_pitches['gameday_zone'].apply(expected_strike)
taken_pitches['actual_call']   = taken_pitches['result_code'].apply(actual_strike)
taken_pitches['correct_call']  = taken_pitches['expected_call'] == taken_pitches['actual_call']
Overall umpire performance in 2023
We begin the analysis by getting a sense of the scale of how many calls umpires make in a season and per game.
print("Number of pitches thrown in 2023:", len(all_pitches))
print("Average pitches thrown per game in 2023:", len(all_pitches) / 2430)
print("Number of taken pitches in 2023:", len(taken_pitches))
print("Average taken pitches per game in 2023:", len(taken_pitches) / 2430)
print("Percent of all pitches taken in 2023:", len(taken_pitches) / len(all_pitches) * 100)
Number of pitches thrown in 2023: 717945
Average pitches thrown per game in 2023: 295.45061728395063
Number of taken pitches in 2023: 374426
Average taken pitches per game in 2023: 154.08477366255144
Percent of all pitches taken in 2023: 52.15246293239733
One of the surprising takeaways from this data is how many pitches umpires look at where they don't have to make a call, ball or strike. Nearly half of the pitches thrown in MLB in 2023 are swung at. This reduces the workload of umpires having to make those ball and strike calls (although this becomes workload managing other aspects of the game).
Now, let's see how they have done at all these pitches.
print("Number of incorrect calls in 2023:", len(taken_pitches[taken_pitches["correct_call"] == False]))
print("Average incorrect calls per game in 2023:", len(taken_pitches[taken_pitches["correct_call"] == False])/ 2430)
overall_accuracy = taken_pitches["correct_call"].mean() * 100
print("Overall umpire accuracy in 2023:", overall_accuracy)
print("Overall bad call ratio (BCR) in 2023:", 100 - (taken_pitches["correct_call"].mean() * 100))
Number of incorrect calls in 2023: 26741
Average incorrect calls per game in 2023: 11.004526748971193
Overall umpire accuracy in 2023: 92.85813485174641
Overall bad call ratio (BCR) in 2023: 7.141865148253586
This shows that over the course of a season, umpires have missed a staggering number of calls, about 7% of all ball/strike calls they make are wrong, and over 10 per game. This proportion of the number of incorrect calls is known as the bad call ratio (BCR), and is already a well-studied topics in umpire sabermetrics.
It may seem like umpires are terrible at their jobs! Although this tutorial does not cover historical data, we can tell you based on a 2019 Boston University study that overall umpire accuracy has increased year on year for over a decade, and that 2023 was the best year in terms of umpire accuracy. Although you may still say that this is still not enough!
Accuracy by pitch speed
Pitchers often vary the speed of pitches in order to confuse a batter's timing. In addition, pitchers whose fastballs are very fast (say, at least 100 mph) often dominate hitters because of the limited time that they have to react to an oncoming pitch. We would like to review how umpires stack up against pitches of different speed. Note that pitch speed is typically considered "out-of-hand" i.e. when the balls is released from the pitcher's hand (baseballs usually slow down as it travels towards home plate).
First, let's see a distribution of the speeds of all taken pitches in 2023:
plt.hist(all_pitches["start_speed"], bins=np.arange(75, 101, 1))
plt.ylabel("Count of pitches in 2023")
plt.xlabel("Release speed of pitch (mph)")
plt.title("Histogram of pitch release speeds of taken pitches in 2023")
plt.show()

Most pitches fall between 75 and 100 mph. Notably, there's a bimodal distribution present here. This is because of different pitch types: the first peak encompasses off-speed pitches and breaking balls, while the second peak covers fastballs. We'll discuss this in greater detail in the next section. For now, let's look at umpire accuracy as a function of pitch speed:
taken_pitches["speed"] = pd.cut(taken_pitches["start_speed"], bins=np.arange(75, 101, 1))
speed_pitches = taken_pitches.groupby("speed", observed=False)
plt.plot(np.arange(76, 101, 1), speed_pitches["correct_call"].mean() * 100)
plt.plot([75, 100], [overall_accuracy, overall_accuracy], linestyle='dashed')
plt.xlabel("Release speed of pitch (mph)")
plt.ylabel("Umpire accuracy on called pitches")
plt.title("Umpire accuracy vs. pitch speed")
plt.show()

Recall that the average accuracy between all pitches is about 92.8%, which we have also graphed as a dashed orange line. Compared to the overall average, umpires seem to be much more accurate for pitches less than 90 mph, while umpires have more trouble with pitches between 90 and 100 mph, although the accuracy seems to recover nearer to 100 mph. This could be explainable with the claim that slow pitches are easier to track with the eyes versus faster pitches. But is having a pitch be merely faster more difficult to call? We think there is more going on.
Accuracy by pitch type
As we may have spoiled earlier, not all pitches are created equal. Pitches not only vary in their speed, but also the spin rate as thrown by the pitcher. The spin has a tendency to influence the break of the pitch, which is how much the pitch moves left or right, up or down (accounting for gravity). For example, the curveball is a type of pitch, with a downward spin which gives the appearance that the ball is diving towards the plate as it moves towards the batter.
MLB's Statcast defines three classes of pitches: fastballs, the main type of pitch thrown the hardest; offspeed pitches, designed to look like fastballs, but are thrown slower in order to disrupt the batter's timing and prompt a swing and miss; and breaking balls, thrown with a lot of spin to invoke significant horziontal or vertical break.
The pitch types we will cover are the following (specifying both the two letter pitch_code as appears in the data and the full name of the pitch)
- fastballs
- FF (four-seam fastball)
- SI (sinking fastball)
- FC (cut fastball)
- offspeed pitches
- CH (changeup)
- FS (splitter)
- breaking balls
- CU (curveball)
- KC (knuckle curve)
- SL (slider)
- ST (sweeper)
- SV (slurve)
There are a few other pitch types, but we exclude them since there were fewer than 1,000 calls made on that type of pitch in 2023:
pitch_types = pd.DataFrame({
                        'name': pitch_code,
                        'num_calls': pitches['correct_call'].count(),
                        'accuracy': pitches['correct_call'].mean() * 100,
                    } for pitch_code, pitches in taken_pitches.groupby("pitch_code"))
pitch_types = pitch_types[pitch_types["num_calls"] > 1000].sort_values(by="num_calls", ascending=False)

plt.bar(pitch_types['name'], pitch_types['num_calls'],
        color=['red', 'green', 'red', 'blue', 'green', 'red', 'green', 'blue', 'green', 'green'])
plt.xlabel("Pitch type")
plt.ylabel("Number of calls")
plt.title("Number of calls by pitch type")
plt.plot()
[]

We've colored the bars so that fastballs are in red, breaking balls are in green, and offspeed pitches in blue.
Now, let's see how accurate MLB umpires are against these type of pitches:
pitch_types = pd.DataFrame({
                        'name': pitch_code,
                        'num_calls': pitches['correct_call'].count(),
                        'accuracy': pitches['correct_call'].mean() * 100,
                    } for pitch_code, pitches in taken_pitches.groupby("pitch_code"))
pitch_types = pitch_types[pitch_types["num_calls"] > 1000].sort_values(by="accuracy", ascending=False)

plt.bar(pitch_types['name'], pitch_types['accuracy'],
        color=['blue', 'blue', 'green', 'green', 'green', 'green', 'green', 'red', 'red', 'red'])
plt.plot([-0.5, 9.5], [overall_accuracy, overall_accuracy], linestyle='dashed', color='orange')
plt.ylim(90, 96)
plt.xlabel("Pitch type")
plt.ylabel("Umpire accuracy on called pitches")
plt.title("Umpire accuracy vs. pitch type")
plt.plot()
[]

We've included the overall accuracy as a dashed orange line. As it turns out, accuracy is correlated to pitch type: fastballs are the hardest to call, followed by breaking balls, and offspeed pitches are the easiest with over 95% accuracy.
Heatmaps of called strikes
As we explained earlier, the (computerized) strike zone is a 2D rectangle, so we'd like to see how accurate umpires are in certain locations of the strike zone.
Before we can do this, however, we should normalize the px and pz values for the pitch location. Here's how we'll do it:
The horizontal
pxlocation will be normalized depending on the batter's handedness, which is inbatter_side. This is because horizontal pitches are considered in terms of "inside" and "outside" to the batter rather than left and right. In fact, umpires tend to set up on the inside part of the plate of the batter: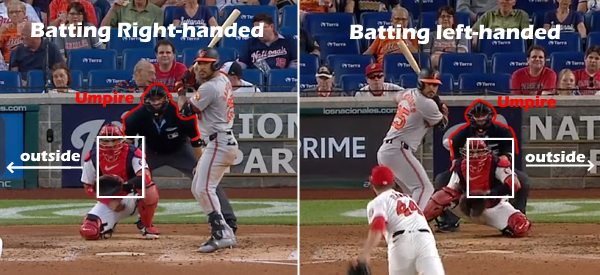
The normalized
norm_pxvalue will be on the same scale aspx, except that negative values ofpxalways correspond to the inside part of the plate while positive values are to the outside part of the plate, instead of merely left and right.The verticality of the pitch depends on
pzand the bounds of the vertical strike zonesz_topandsz_bot, so we fix a standardSZ_TOPandSZ_BOTcorresponding to the average among all batters, which is roughly3.40and1.60, respectively.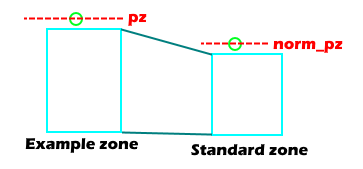
The
norm_pzvalue records the vertical position of the pitch with respect toSZ_TOPandSZ_BOT.
SZ_TOP = 3.40
SZ_BOT = 1.60
RAD = 0.12

def normalized_pz(df):
    pz = df['pz']
    sz_top = df['sz_top']
    sz_bot = df['sz_bot']

    if pz > sz_top - RAD:
        return pz - sz_top + SZ_TOP
    elif pz < sz_bot + RAD:
        return pz - sz_bot + SZ_BOT
    else:
        return SZ_BOT + (SZ_TOP - SZ_BOT) * ((pz - sz_bot) / (sz_top - sz_bot))

def normalized_px(df):
    pz = df['px']
    side = df['batter_side']

    return -pz if side == "L" else pz

taken_pitches["px_norm"] = taken_pitches.apply(normalized_px, axis=1)
taken_pitches["pz_norm"] = taken_pitches.apply(normalized_pz, axis=1)
Now that we have these normalized values, we can now graph all pitches from 2023 on the same strike zone. We'll do this by constructing a heatmap of called strikes.
PLATE_EDGE = 17/24 + 0.12
MIDDLE = (3.4 + 1.6) / 2
HALF_HEIGHT = 1.02

taken_pitches["horiz_zone"] = pd.cut(taken_pitches["px_norm"], bins=np.linspace(-PLATE_EDGE * 2, PLATE_EDGE * 2, 33))
taken_pitches["vert_zone"]  = pd.cut(taken_pitches["pz_norm"], bins=np.linspace(MIDDLE - HALF_HEIGHT * 2, MIDDLE + HALF_HEIGHT * 2, 33))
zoned_pitches = taken_pitches.groupby(["vert_zone", "horiz_zone"], observed=False)["expected_call"].mean().unstack()[::-1]
sns.heatmap(zoned_pitches)

plt.gca().set_aspect(0.255/0.207)       # set square aspect ratio
plt.plot([8,8,24,24,8],[8,24,24,8,8], color="green")
plt.xticks([], [])
plt.xlabel("Normalized horizontal location")
plt.yticks([], [])
plt.ylabel("Normalized vertical location")
plt.title("Heatmap of expected calls on pitches")
plt.show()

zoned_pitches = taken_pitches.groupby(["vert_zone", "horiz_zone"], observed=False)["actual_call"].mean().unstack()[::-1]
sns.heatmap(zoned_pitches)

plt.gca().set_aspect(0.255/0.207)       # set square aspect ratio
plt.plot([8,8,24,24,8],[8,24,24,8,8], color="green")
plt.xticks([], [])
plt.xlabel("Normalized horizontal location")
plt.yticks([], [])
plt.ylabel("Normalized vertical location")
plt.title("Heatmap of expected calls on pitches")
plt.show()


The first heatmap shows what the ideal heatmap should look like. We have set up the scale so that any pitch within the green box is in the zone, and thus should have been called a strike (and so should be completely bright white). Any pitch outside the box should be called a ball (and so should be completely black).
Each square in the second heatmap represents the proportion of pitches which are in that area that were called strikes by MLB umpires in 2023. What we see is that the zone is not necessarily a rectangle, but more an oval. It shows that the pitches at the corners are not called strikes very often, while pitches off the inside and outside edges of the zone are called strikes at a pretty high proportion. In particular, we can see that the area off to the right side (which denotes the outside zone) is slightly brighter than on the left side (which is the inside zone).
This shows that umpires are more likely to call a strike off the outside part of the plate compare to the inside part. This theory lines up with how umpires typically set up to the inside of the batter. Since they are looking straight on at that edge, they end up having an easier time calling pitches to the inside part, rather than the outside part, where they are looking off at an angle.
Umpires less likely to strike out batters
As we have discussed earlier, the call of an umpire can have a significant influence on the result of a plate appearance. For example, an incorrect strike call on two strikes means that the batter is out, rather than having more changes to bat. The heatmap above showed us how often umpires called strikes in certain places of the zone. Let's see how it looks when an umpire makes a call when the count has two strikes.
zoned_pitches_strike2 = taken_pitches[taken_pitches["strikes"] == 2].groupby(["vert_zone", "horiz_zone"], observed=False)["actual_call"].mean().unstack()[::-1]
sns.heatmap(zoned_pitches_strike2)

plt.gca().set_aspect(0.255/0.207)       # set square aspect ratio
plt.plot([8,8,24,24,8],[8,24,24,8,8], color="green")
plt.xticks([], [])
plt.xlabel("Normalized horizontal location")
plt.yticks([], [])
plt.ylabel("Normalized vertical location")
plt.title("Heatmap of expected calls on pitches with 2 strikes")
plt.show()

lim = (zoned_pitches_strike2 - zoned_pitches).abs().max().max()
sns.heatmap(zoned_pitches_strike2 - zoned_pitches, cmap="coolwarm", vmin=-lim, vmax=lim)

plt.gca().set_aspect(0.255/0.207)       # set square aspect ratio
plt.plot([8,8,24,24,8],[8,24,24,8,8], color="green")
plt.xticks([], [])
plt.xlabel("Normalized horizontal location")
plt.yticks([], [])
plt.ylabel("Normalized vertical location")
plt.title("Difference of expected calls on pitches with 2 strikes")
plt.show()


The first heatmap seemed hard to interpret, so we have a second chart which plots the difference from the heatmap on two strikes versus the heatmap for all pitches. Red squares mean that umpires are more likely to call a strike on with two strikes in the count than in general, and blue squares the opposite. The overwhelming blue on the chart shows us that umpires are much less to call strike 3 on a batter, especially on pitches on the edge of the zone.
Analysis, hypothesis testing, & ML
We would like to build a model which represents the average umpire based on 2023 data. This would help us get a better sense of who the better umpires are and what aspects of a pitch are more influential towards ball and strike calls. This involves creating a binary classifier using pitch data to predict what an umpire's call would be. Note that we don't care about what the expected call of a pitch is (representing whether or not the pitch was in the zone or not), since that is very easy to calculate. Instead, we want to predict what the umpire's actual call will be. We will use the decision tree classifier to accomplish this.
First, we must define the subset of features from the data that we will use to train the model. We have selected the following features based on our previous discussions:
px_norm: horizontal position of the pitch taking batter's handedness into accountpz: vertical location of the pitchsz_topandsz_bot: vertical bounds for the strike zone. Note that we aren't usingpz_norm, since the bounds of the strike zones themselves can have influence on the pitch callbreak_xandbreak_z: this encodes the amount of break of the pitch, which is a function of the pitch type discussed earlierstart_speed: release speed of the pitchballsandstrikes: the current count
feature_cols = ['px_norm', 'pz', 'sz_top', 'sz_bot', 'break_x', 'break_z', 'start_speed', 'balls', 'strikes']
X = taken_pitches[feature_cols] # Features
y = taken_pitches.actual_call
Next, we split up the data into training data and test data. Since there is a large amount of data available (370,000 pitches), we choose a split of 80% training data, 20% test data.
X_train, X_test, y_train, y_test = train_test_split(X, y, test_size=0.20, shuffle=True)

print("Training set size:", len(X_train))
print("Testing set size:", len(X_test))
Training set size: 299540
Testing set size: 74886
We now set up our decision tree classifier and train it using the training data that we found.
tree_model = DecisionTreeClassifier()
tree_model = tree_model.fit(X_train, y_train)
With our model fitted to the training data, we now use it to predict the classification of the test data.
y_pred_tree = tree_model.predict(X_test)
Let's see how accurate this was!
print("Accuracy: ", metrics.accuracy_score(y_test, y_pred_tree))
Accuracy: 0.9090751275271747
This is not a bad score. It's not possible to get a perfect score outside of the training data because it's possible (and likely happened) that two umpires have called the same exact pitch two different ways.
Let's get a classification report for this.
print(classification_report(y_test, y_pred_tree))
              precision    recall  f1-score   support

       False       0.93      0.93      0.93     51445
        True       0.85      0.85      0.85     23441

    accuracy                           0.91     74886
   macro avg       0.89      0.89      0.89     74886
weighted avg       0.91      0.91      0.91     74886
We construct a confusion matrix corresponding to the results of predicting the test data.
class_names=["False", "True"] # name  of classes
fig, ax = plt.subplots()
tick_marks = np.arange(len(class_names))
plt.xticks(tick_marks, class_names)
plt.yticks(tick_marks, class_names)
# create heatmap
cnf_matrix_tree = metrics.confusion_matrix(y_test, y_pred_tree)
sns.heatmap(pd.DataFrame(cnf_matrix_tree), annot=True, cmap="YlGnBu" ,fmt='g')
ax.xaxis.set_label_position("top")
plt.tight_layout()
plt.title('Confusion matrix', y=1.1)
plt.ylabel('Actual label')
plt.xlabel('Predicted label')
Text(0.5, 427.9555555555555, 'Predicted label')

We also plot the receiver operating characteristic curve:
y_pred_proba_tree = tree_model.predict_proba(X_test)[::,1]
fpr, tpr, _ = metrics.roc_curve(y_test,  y_pred_proba_tree)
auc = metrics.roc_auc_score(y_test, y_pred_proba_tree)
plt.plot(fpr,tpr,label="data 1, auc="+str(auc))
plt.legend(loc=4)
plt.title("Receiver operating characteristics curve")
plt.show()

And here's a look into the inner workings of the decision tree.
plt.figure(figsize=(20,10))
tree.plot_tree(tree_model, filled=True, fontsize=10, feature_names=feature_cols, max_depth=3)
plt.show()

Last, we'd like to look at how important all the features are in predicting the output.
# Checking feature importance
importances = pd.DataFrame({'feature': X_train[feature_cols].columns, 'importance': tree_model.feature_importances_}).sort_values('importance', ascending=False)
print(importances)
       feature  importance
0      px_norm    0.444101
1           pz    0.397211
2       sz_top    0.035773
3       sz_bot    0.035729
4      break_x    0.027359
5      break_z    0.024478
6  start_speed    0.023337
7        balls    0.006391
8      strikes    0.005621
Unsurprisingly, the vertical and horizontal positions pz and px_norm are the most important features towards determining if an umpire will call a pitch a ball or a strike. Next up is sz_bot and sz_top, which we would expect because it is needed to determine if a pitch falls inthe vertical strike zone.
By the computer rules, those would be the only four factors that determine ball or strike. However, we also see importance in break_x, break_z, and start_speed, showing that the shape of the pitch also has some influence on the pitch's call. We also see that the count of balls and strikes are the least important features.
Insight and policy decisions
At the end of the day, we would like to reward good MLB umpires and recognize superior ability in calling balls and strikes. In practice, this is done through crew chief promotions (becoming the leader of the four-man umpiring crew he is a part of) and postseason assignments (where he will get to work the most important games).
We would also like to highlight struggling umpires and determine what they need to spend time improving.
As an example, we'll use our trained model to assess the performance of umpires during the 2023 postseason (we only considered regular season up to this point, but postseason gives us a little more data that we can apply our models to). First, let's get the data from those games.
r = requests.get("https://statsapi.mlb.com/api/v1/schedule",
                 params={"sportId": 1,              # indicates Major League Baseball (AL + NL)
                         "startDate": "2023-01-01", # start of 2023
                         "endDate": "2023-12-01",   # end of 2023
                         "gameTypes": ["F", "D", "L", "W"]})
# postseason game types include
#   F = wild card series
#   D = divison series
#   L = league championship series
#   W = world series

# The query includes a list of dates, and each date has a list of games for that day.
query = json.loads(r.content)

# extract each game_pk
game_pks = []
for date in query['dates']:
    for game in date['games']:
        game_pks.append(game['gamePk'])

# get rid of duplicates (happens due to postponements, which double counts the game for the originally scheduled date and actual date of the game)
games = list(set(game_pks))

print(len(games))                               # total number of games
41
game_pitches = list(map(get_game_pitches, games))

postseason_pitches = pd.concat(game_pitches, ignore_index = True)
postseason_pitches.set_index("play_id", inplace=True)
postseason_pitches.head()
| inning | ab_number | cap_index | batter | stand | batter_name | pitcher | p_throws | pitcher_name | team_batting | team_fielding | team_batting_id | team_fielding_id | result | des | events | contextMetrics | strikes | balls | pre_strikes | pre_balls | call | call_name | pitch_type | pitch_name | description | result_code | pitch_call | is_strike_swinging | balls_and_strikes | start_speed | end_speed | sz_top | sz_bot | extension | plateTime | zone | spin_rate | px | pz | x0 | y0 | z0 | ax | ay | az | vx0 | vy0 | vz0 | pfxX | pfxZ | pfxZWithGravity | pfxZWithGravityNice | pfxZDirection | pfxXWithGravity | pfxXNoAbs | pfxXDirection | breakX | breakZ | inducedBreakZ | hit_speed_round | hit_speed | hit_distance | xba | hit_angle | is_barrel | hc_x | hc_x_ft | hc_y | hc_y_ft | is_bip_out | pitch_number | player_total_pitches | player_total_pitches_pitch_types | game_total_pitches | rowId | game_pk | player_name | runnerOn1B | runnerOn2B | runnerOn3B | half_inning | away_team | away_abbrev | home_team | home_abbrev | date | day_night | plate_umpire | outs | runner_going | spinDirection | event_type | event_description | breakVertical | breakHorizontal | breakLength | breakAngle | |
|---|---|---|---|---|---|---|---|---|---|---|---|---|---|---|---|---|---|---|---|---|---|---|---|---|---|---|---|---|---|---|---|---|---|---|---|---|---|---|---|---|---|---|---|---|---|---|---|---|---|---|---|---|---|---|---|---|---|---|---|---|---|---|---|---|---|---|---|---|---|---|---|---|---|---|---|---|---|---|---|---|---|---|---|---|---|---|---|---|---|---|---|---|---|---|---|---|---|---|
| play_id | ||||||||||||||||||||||||||||||||||||||||||||||||||||||||||||||||||||||||||||||||||||||||||||||||||
| 4a069011-5958-4fc4-af7c-1a8e37395891 | 1 | 4 | 0 | 606466 | R | Ketel Marte | 650911 | L | Cristopher Sánchez | AZ | PHI | 109 | 143 | Groundout | Ketel Marte grounds out, second baseman Bryson... | Groundout | {'homeRunBallparks': 0} | 0 | 0 | 0 | 0 | X | In Play | SI | Sinker | In play, out(s) | X | hit_into_play | False | 00 | 92.2 | 84.4 | 3.540000 | 1.690000 | 6.791236 | 0.408719 | 9 | 1970 | 0.807688 | 2.162640 | 1.748492 | 50.002941 | 5.834315 | 19.856549 | 29.578406 | -26.116662 | -6.241417 | -134.122073 | -4.777216 | 10.922046 | 3.330782 | -26.611854 | 27 | ↓ | 18 | 18 | ← | 18.0 | 27.0 | 6.0 | 100.0 | 99.6 | 6 | .110 | -22 | 0.0 | 138.08 | 31.045509 | 124.83 | 189.381761 | Y | 1 | 1 | 1 | 23 | 23-748544 | 748544 | PHI | NaN | NaN | NaN | bottom | Philadelphia Phillies | PHI | Arizona Diamondbacks | AZ | 2023-10-20 | night | Mike Muchlinski | 0 | False | 117.0 | field_out | Groundout | -27.1 | -18.4 | 7.2 | 34.8 |
| 1c820466-a1e0-4c76-a43f-798929e1a444 | 1 | 5 | 0 | 682998 | L | Corbin Carroll | 650911 | L | Cristopher Sánchez | AZ | PHI | 109 | 143 | Groundout | Corbin Carroll grounds out, pitcher Cristopher... | Groundout | {} | 0 | 0 | 0 | 0 | S | Strike | SI | Sinker | Called Strike | C | called_strike | False | 00 | 92.9 | 85.1 | 3.170675 | 1.576307 | 7.080770 | 0.405783 | 4 | 2015 | -0.554020 | 2.560673 | 1.719392 | 50.004482 | 5.804752 | 19.404949 | 28.987894 | -24.830040 | -9.698387 | -134.912303 | -3.986018 | 10.511402 | 3.978887 | -25.055092 | 25 | ↓ | 18 | 18 | ← | 17.0 | 25.0 | 7.0 | NaN | NaN | NaN | NaN | NaN | NaN | NaN | NaN | NaN | NaN | Y | 1 | 2 | 2 | 24 | 24-748544 | 748544 | NaN | NaN | NaN | NaN | bottom | Philadelphia Phillies | PHI | Arizona Diamondbacks | AZ | 2023-10-20 | night | Mike Muchlinski | 1 | False | 115.0 | field_out | Groundout | -25.2 | -17.0 | 7.2 | 33.6 |
| c1a0cdf7-d190-4be0-964c-bd4de540240e | 1 | 5 | 0 | 682998 | L | Corbin Carroll | 650911 | L | Cristopher Sánchez | AZ | PHI | 109 | 143 | Groundout | Corbin Carroll grounds out, pitcher Cristopher... | Groundout | {} | 1 | 0 | 1 | 0 | S | Strike | SI | Sinker | Foul | F | foul | False | 01 | 92.8 | 85.1 | 3.140000 | 1.480000 | 7.046580 | 0.406061 | 5 | 1934 | -0.090677 | 2.041874 | 1.807166 | 50.001698 | 5.771773 | 18.373196 | 29.081882 | -25.919565 | -8.503464 | -134.844971 | -5.066663 | 9.968781 | 3.392270 | -26.089912 | 26 | ↓ | 17 | 17 | ← | 16.0 | 26.0 | 6.0 | NaN | NaN | NaN | NaN | NaN | NaN | NaN | NaN | NaN | NaN | Y | 2 | 3 | 3 | 25 | 25-748544 | 748544 | NaN | NaN | NaN | NaN | bottom | Philadelphia Phillies | PHI | Arizona Diamondbacks | AZ | 2023-10-20 | night | Mike Muchlinski | 1 | False | 111.0 | field_out | Groundout | -26.6 | -16.2 | 7.2 | 31.2 |
| cd48ca82-50a3-4603-a9fa-8a8cbce8944e | 1 | 5 | 0 | 682998 | L | Corbin Carroll | 650911 | L | Cristopher Sánchez | AZ | PHI | 109 | 143 | Groundout | Corbin Carroll grounds out, pitcher Cristopher... | Groundout | {} | 2 | 0 | 2 | 0 | B | Ball | CH | Changeup | Ball | B | ball | False | 02 | 82.9 | 76.4 | 3.170675 | 1.477469 | 7.000006 | 0.455212 | 14 | 1953 | 0.113231 | 0.314335 | 1.933014 | 50.001007 | 5.593012 | 13.870536 | 23.808931 | -31.199647 | -7.242118 | -120.413762 | -5.970624 | 9.464740 | 0.660322 | -38.877095 | 39 | ↓ | 16 | 16 | ← | 15.0 | 39.0 | 1.0 | NaN | NaN | NaN | NaN | NaN | NaN | NaN | NaN | NaN | NaN | Y | 3 | 4 | 1 | 26 | 26-748544 | 748544 | NaN | NaN | NaN | NaN | bottom | Philadelphia Phillies | PHI | Arizona Diamondbacks | AZ | 2023-10-20 | night | Mike Muchlinski | 1 | False | 98.0 | field_out | Groundout | -40.1 | -15.4 | 9.6 | 21.6 |
| 3c3f127a-a0e8-46bb-903e-9b8a0afbbca6 | 1 | 5 | 0 | 682998 | L | Corbin Carroll | 650911 | L | Cristopher Sánchez | AZ | PHI | 109 | 143 | Groundout | Corbin Carroll grounds out, pitcher Cristopher... | Groundout | {'homeRunBallparks': 0} | 2 | 1 | 2 | 1 | X | In Play | CH | Changeup | In play, out(s) | X | hit_into_play | False | 12 | 83.2 | 76.4 | 3.140000 | 1.480000 | 6.907456 | 0.452515 | 12 | 1933 | 1.045599 | 2.659124 | 1.871132 | 50.003868 | 5.889874 | 14.959764 | 23.784962 | -33.967735 | -5.102493 | -121.073603 | -0.612647 | 10.082693 | -1.208386 | -41.562701 | 42 | ↓ | 17 | 17 | ← | 17.0 | 41.0 | -1.0 | 61.0 | 60.8 | 19 | .070 | -7 | 0.0 | 125.30 | 0.241108 | 180.76 | 54.570326 | Y | 4 | 5 | 2 | 27 | 27-748544 | 748544 | NaN | NaN | NaN | NaN | bottom | Philadelphia Phillies | PHI | Arizona Diamondbacks | AZ | 2023-10-20 | night | Mike Muchlinski | 1 | False | 97.0 | field_out | Groundout | -41.6 | -17.0 | 9.6 | 22.8 |
Next, we'll clean this dataset in the same way we cleaned the regular season pitches and add in some extra columns that we added in the exploratory data analysis section.
postseason_pitches.rename({'stand': 'batter_side',
                    'p_throws': 'pitcher_hand',
                    'pitch_type': 'pitch_code',
                    'pitch_name': 'pitch_description',
                    'description': 'result_description',
                    'plateTime': 'plate_time',
                    'zone': 'gameday_zone',
                    'pfxX': 'pfx_x', 'pfxZ': 'pfx_z',
                    'breakHorizontal': 'break_x', 'breakVertical': 'break_z',
                    'breakLength': 'break_length', 'breakAngle': 'break_angle',
                    "spinDirection": "spin_axis",
                    'runnerOn1B': 'runner_1b',
                    'runnerOn2B': 'runner_2b',
                    'runnerOn3B': 'runner_3b'}, axis=1,inplace=True)
# reorder columns and drop the columns that we don't want
postseason_pitches = postseason_pitches[['game_pk', 'date', 'day_night',
                           'away_team', 'away_abbrev', 'home_team', 'home_abbrev',
                           'game_total_pitches',
                           'inning', 'half_inning', 'outs',
                           'runner_1b', 'runner_2b', 'runner_3b', 'runner_going',
                           'batter_name', 'batter_side', 'pitcher_name', 'pitcher_hand',
                           'pitch_number',
                           'balls', 'strikes',
                           'result_code', 'result_description',
                           'px', 'pz', 'sz_top', 'sz_bot',
                           'gameday_zone',
                           'pitch_code', 'pitch_description',
                           'start_speed', 'end_speed', 'plate_time',
                           'x0', 'y0', 'z0',
                           'vx0', 'vy0', 'vz0',
                           'ax', 'ay', 'az',
                           'pfx_x', 'pfx_z',
                           'spin_rate', 'spin_axis',
                           'break_x', 'break_z',
                           'break_length', 'break_angle',
                           'event_type', 'event_description',
                           'plate_umpire']]
postseason_pitches["runner_1b"] = postseason_pitches["runner_1b"].fillna(False)
postseason_pitches["runner_2b"] = postseason_pitches["runner_2b"].fillna(False)
postseason_pitches["runner_3b"] = postseason_pitches["runner_3b"].fillna(False)
result_codes = ["*B", "B", "C", "H", "I", "P"]
postseason_taken_pitches = postseason_pitches[postseason_pitches['result_code'].isin(result_codes)]
postseason_taken_pitches = postseason_taken_pitches.dropna()

postseason_taken_pitches['expected_call'] = postseason_taken_pitches['gameday_zone'].apply(expected_strike)
postseason_taken_pitches['actual_call']   = postseason_taken_pitches['result_code'].apply(actual_strike)
postseason_taken_pitches['correct_call']  = postseason_taken_pitches['expected_call'] == postseason_taken_pitches['actual_call']

postseason_taken_pitches["px_norm"] = postseason_taken_pitches.apply(normalized_px, axis=1)
postseason_taken_pitches["pz_norm"] = postseason_taken_pitches.apply(normalized_pz, axis=1)

print("Number of taken pitches in the 2023 postseason:", len(postseason_pitches))
postseason_taken_pitches.head()
Number of taken pitches in the 2023 postseason: 11829
| game_pk | date | day_night | away_team | away_abbrev | home_team | home_abbrev | game_total_pitches | inning | half_inning | outs | runner_1b | runner_2b | runner_3b | runner_going | batter_name | batter_side | pitcher_name | pitcher_hand | pitch_number | balls | strikes | result_code | result_description | px | pz | sz_top | sz_bot | gameday_zone | pitch_code | pitch_description | start_speed | end_speed | plate_time | x0 | y0 | z0 | vx0 | vy0 | vz0 | ax | ay | az | pfx_x | pfx_z | spin_rate | spin_axis | break_x | break_z | break_length | break_angle | event_type | event_description | plate_umpire | expected_call | actual_call | correct_call | px_norm | pz_norm | |
|---|---|---|---|---|---|---|---|---|---|---|---|---|---|---|---|---|---|---|---|---|---|---|---|---|---|---|---|---|---|---|---|---|---|---|---|---|---|---|---|---|---|---|---|---|---|---|---|---|---|---|---|---|---|---|---|---|---|---|---|
| play_id | |||||||||||||||||||||||||||||||||||||||||||||||||||||||||||
| 1c820466-a1e0-4c76-a43f-798929e1a444 | 748544 | 2023-10-20 | night | Philadelphia Phillies | PHI | Arizona Diamondbacks | AZ | 24 | 1 | bottom | 1 | False | False | False | False | Corbin Carroll | L | Cristopher Sánchez | L | 1 | 0 | 0 | C | Called Strike | -0.554020 | 2.560673 | 3.170675 | 1.576307 | 4 | SI | Sinker | 92.9 | 85.1 | 0.405783 | 1.719392 | 50.004482 | 5.804752 | -9.698387 | -134.912303 | -3.986018 | 19.404949 | 28.987894 | -24.830040 | 10.511402 | 3.978887 | 2015 | 115.0 | -17.0 | -25.2 | 7.2 | 33.6 | field_out | Groundout | Mike Muchlinski | True | True | True | 0.554020 | 2.711324 |
| cd48ca82-50a3-4603-a9fa-8a8cbce8944e | 748544 | 2023-10-20 | night | Philadelphia Phillies | PHI | Arizona Diamondbacks | AZ | 26 | 1 | bottom | 1 | False | False | False | False | Corbin Carroll | L | Cristopher Sánchez | L | 3 | 0 | 2 | B | Ball | 0.113231 | 0.314335 | 3.170675 | 1.477469 | 14 | CH | Changeup | 82.9 | 76.4 | 0.455212 | 1.933014 | 50.001007 | 5.593012 | -7.242118 | -120.413762 | -5.970624 | 13.870536 | 23.808931 | -31.199647 | 9.464740 | 0.660322 | 1953 | 98.0 | -15.4 | -40.1 | 9.6 | 21.6 | field_out | Groundout | Mike Muchlinski | False | False | True | -0.113231 | 0.436866 |
| 388feb8e-d1f5-4d21-9e13-4a352304b64e | 748544 | 2023-10-20 | night | Philadelphia Phillies | PHI | Arizona Diamondbacks | AZ | 28 | 1 | bottom | 2 | False | False | False | False | Gabriel Moreno | R | Cristopher Sánchez | L | 1 | 0 | 0 | C | Called Strike | 0.721545 | 2.922909 | 3.387163 | 1.540415 | 3 | SI | Sinker | 92.9 | 85.2 | 0.404773 | 1.715875 | 50.003105 | 5.898742 | -6.095500 | -135.249815 | -3.287519 | 18.377603 | 29.130897 | -24.914057 | 9.906351 | 3.914399 | 1905 | 112.0 | -16.7 | -25.1 | 7.2 | 33.6 | field_out | Pop Out | Mike Muchlinski | True | True | True | 0.721545 | 2.947498 |
| d9cb9575-854d-4a0e-ad6f-cdb9fb9a9015 | 748544 | 2023-10-20 | night | Philadelphia Phillies | PHI | Arizona Diamondbacks | AZ | 29 | 1 | bottom | 2 | False | False | False | False | Gabriel Moreno | R | Cristopher Sánchez | L | 2 | 0 | 1 | B | Ball | 1.675490 | 2.123989 | 3.387163 | 1.540415 | 14 | CH | Changeup | 83.4 | 76.7 | 0.451117 | 1.973322 | 50.000187 | 5.693863 | -3.682712 | -121.498678 | -1.472341 | 14.231832 | 24.210927 | -33.958942 | 9.538274 | -1.200168 | 1931 | 96.0 | -16.3 | -41.5 | 9.6 | 21.6 | field_out | Pop Out | Mike Muchlinski | False | False | True | 1.675490 | 2.168802 |
| 217c2826-97bd-4c58-b897-7ba41b98b6ed | 748544 | 2023-10-20 | night | Philadelphia Phillies | PHI | Arizona Diamondbacks | AZ | 30 | 1 | bottom | 2 | False | False | False | False | Gabriel Moreno | R | Cristopher Sánchez | L | 3 | 1 | 1 | B | Ball | 1.806079 | 2.216680 | 3.387163 | 1.540415 | 14 | CH | Changeup | 82.8 | 76.2 | 0.454571 | 1.968776 | 50.004734 | 5.781904 | -3.459456 | -120.521864 | -1.592752 | 14.618907 | 23.557022 | -32.770355 | 9.942277 | -0.402354 | 1845 | 98.0 | -17.2 | -40.8 | 9.6 | 22.8 | field_out | Pop Out | Mike Muchlinski | False | False | True | 1.806079 | 2.259146 |
Next, we will apply our model by calculating a "credit" value for each pitch:
- if the umpire's actual call is the same as the predicted call by the model, then the credit for that pitch is 0, since that umpire and the average umpire both agree (so one can't be more correct than the other)
- if the umpire's actual call is different than the predicted call, and the umpire's call was correct and the predicated call was wrong, then the umpire recieves
+1credit for that pitch for getting the call correct compared to an average umpire - if the umpire's actual call is different than the predicted call, and the umpire's call was wrong and the predicated call was correct, then the umpire recieves
-1credit for that pitch for getting the call wrong compared to the average umpire
postseason_taken_pitches["pred_call"] = tree_model.predict(postseason_taken_pitches[feature_cols])
def credit(pitch):
    if pitch["pred_call"] == pitch["actual_call"]:
        return 0
    else:
        if pitch['pred_call'] == pitch['expected_call']:
            return -1
        else:
            return 1
postseason_taken_pitches["credit"] = postseason_taken_pitches.apply(credit, axis=1)
Now that we have this, we can group together the umpires in the test set, and calculate the umpire's accuracy and the sum of all the credits, which we will name correct calls above average.
umpire_stats = pd.DataFrame({
                        'umpire_name': umpire,
                        'called': len(pitches),
                        'num_inc': len(pitches[pitches['correct_call'] == False]),
                        'accuracy': pitches['correct_call'].mean(),
                        'calls_above_avg': pitches['credit'].sum()
                    } for umpire, pitches in postseason_taken_pitches.groupby("plate_umpire"))
umpire_stats.set_index("umpire_name", inplace=True)
Here are the five most accurate umpires that we found:
umpire_stats.sort_values("accuracy", ascending=False).head(5)
| called | num_inc | accuracy | calls_above_avg | |
|---|---|---|---|---|
| umpire_name | ||||
| Lance Barksdale | 129 | 2 | 0.984496 | 6 |
| Todd Tichenor | 134 | 4 | 0.970149 | 0 |
| Bill Miller | 158 | 7 | 0.955696 | 5 |
| Brian O'Nora | 133 | 6 | 0.954887 | 3 |
| Brian Knight | 296 | 14 | 0.952703 | 15 |
And here are the five least accurate umpires:
umpire_stats.sort_values("accuracy", ascending=True).head(5)
| called | num_inc | accuracy | calls_above_avg | |
|---|---|---|---|---|
| umpire_name | ||||
| Doug Eddings | 280 | 31 | 0.889286 | -10 |
| Marvin Hudson | 145 | 16 | 0.889655 | -2 |
| Jansen Visconti | 131 | 14 | 0.893130 | -3 |
| Dan Iassogna | 137 | 14 | 0.897810 | -11 |
| David Rackley | 292 | 27 | 0.907534 | -13 |
Lastly, we will use our new correct calls above average metric to determine which umpires are doing better with respect to his fellow umpires:
umpire_stats.sort_values("calls_above_avg", ascending=False).head(5)
| called | num_inc | accuracy | calls_above_avg | |
|---|---|---|---|---|
| umpire_name | ||||
| Brian Knight | 296 | 14 | 0.952703 | 15 |
| Mark Ripperger | 337 | 19 | 0.943620 | 8 |
| Tripp Gibson | 287 | 17 | 0.940767 | 7 |
| Lance Barksdale | 129 | 2 | 0.984496 | 6 |
| Bill Miller | 158 | 7 | 0.955696 | 5 |
And here are the five worst umpires by that metric.
umpire_stats.sort_values("calls_above_avg", ascending=True).head(5)
| called | num_inc | accuracy | calls_above_avg | |
|---|---|---|---|---|
| umpire_name | ||||
| David Rackley | 292 | 27 | 0.907534 | -13 |
| Dan Iassogna | 137 | 14 | 0.897810 | -11 |
| Doug Eddings | 280 | 31 | 0.889286 | -10 |
| Andy Fletcher | 282 | 24 | 0.914894 | -7 |
| Dan Bellino | 329 | 25 | 0.924012 | -6 |
We plot these two metrics together in a scatterplot to show that there is a positive correlation between accuracy and correct calls above average with a linear regression.
plt.scatter(umpire_stats["accuracy"], umpire_stats["calls_above_avg"])


reg = linear_model.LinearRegression()
reg.fit(umpire_stats["accuracy"].values.reshape(-1, 1), umpire_stats["calls_above_avg"])

def regression(x):
    return reg.coef_[0] * x + reg.intercept_

# plot the regression line
plt.axline((0.875, regression(0.875)), (1, regression(1)))

plt.title("Correct calls above average vs. accuracy")
plt.xlabel("Accuracy")
plt.ylabel("Correct calls above average")
plt.show()

The issue with strict metrics like accuracy is that they tend to be agnostic to the type of miss. That is, a borderline miss is treated as much of a missed call as a huge miss. The correct calls above accuracy is just one metric which hopes to shed more light on who the better (and worse) umpires are. If an umpire has a low accuracy number, but a high number of correct calls above average number, then we can surmise that the umpire had a more difficult set of pitches to call which is why they were in accurate. But in comparison to how an average umpire would call it, he was still pretty good. The linear regression gives us that border between being better than the accuracy number suggests: if an umpire is above the trendline, then we can see he did a better job than the raw accuracy number suggested, while umpires below the line did worse than expected.
We used the model trained on 2023 regular season data to assess performance of umpires in the 2023 postseason, which may not be the most ideal conditions since the goal of the model is to find who the best umpires are that deserve postseason assignments. In the future, one could use the 2023 regular season model to assess umpires from the 2024 regular season, and reward the best umpires of 2024 with postseason assignments.